Preface
前文
Source Generators in C# are a powerful feature that allows generating code at compile-time. However, when a Source Generator takes too long to execute, it can significantly slow down the build process. In this article, I’ll share how to profile Source Generator performance using MSBuildStructuredLog and JetBrains dotTrace to identify performance bottlenecks.
The core idea is to manually invoke the C# compiler (csc) to compile a project that uses the Source Generator you want to profile. By using dotTrace to profile this compilation process, we can see the execution time of each function within the Source Generator itself. This allows us to pinpoint exactly which parts of the generator are causing performance issues.
C# 的 Source Generator 是一个强大的功能,允许在编译时生成代码。然而,当 Source Generator 执行时间过长时,会显著拖慢构建过程。本文将分享如何使用 MSBuildStructuredLog 和 JetBrains dotTrace 来分析 Source Generator 的性能,从而找出性能瓶颈。
主要思路是手动调用 C# 的编译器(csc)去编译一个使用了你想要分析性能的 Source Generator 的工程。通过用 dotTrace 去分析这个编译进程,我们可以看到 Source Generator 本身内部每个函数的耗时。这样就能精确定位生成器中哪些部分导致了性能问题。
Prerequisites
前置准备
Before we start, you’ll need to prepare the following tools:
在开始之前,你需要准备以下工具:
MSBuildStructuredLog
MSBuildStructuredLog
A tool for viewing MSBuild binary logs
用于查看 MSBuild 二进制日志的工具
JetBrains dotTrace
JetBrains dotTrace
A .NET profiling tool
.NET 性能分析工具
.NET SDK
.NET SDK
Ensure you have the .NET SDK installed that matches your project version
确保安装了与项目版本匹配的 .NET SDK
Generate Binary Build Log
生成二进制构建日志
First, we need to use the dotnet build command with the -bl parameter to generate a binary log (binlog) file. This file contains all the information about the build process, including compiler invocations and their parameters.
WARNING
Navigate to the project directory that uses the Source Generator you want to profile (where the .csproj file is located) and execute:
首先,我们需要使用 dotnet build 命令加上 -bl 参数来生成一个二进制日志(binlog)文件。这个文件包含了构建过程的所有信息,包括编译器的调用和参数。
WARNING
进入使用了你想要分析性能的 Source Generator 的项目目录(包含 .csproj 文件的目录),然后执行:
dotnet build -blThis command will generate a msbuild.binlog file in the current directory. This file contains detailed information about the build process.
Example output:
这个命令会在当前目录下生成一个 msbuild.binlog 文件,该文件包含了构建过程的详细信息。
示例输出:
❯ dotnet build -bl
Restore succeeded with 3 warning(s) in 0.6s
    /Users/jason/Documents/GitHub/Nino/src/Nino.UnitTests/Nino.UnitTests.csproj : warning NU1701: Package 'Microsoft.CodeAnalysis.CSharp.Workspaces 1.0.1' was restored using '.NETFramework,Version=v4.6.1, .NETFramework,Version=v4.6.2, .NETFramework,Version=v4.7, .NETFramework,Version=v4.7.1, .NETFramework,Version=v4.7.2, .NETFramework,Version=v4.8, .NETFramework,Version=v4.8.1' instead of the project target framework 'net6.0'. This package may not be fully compatible with your project.
    /Users/jason/Documents/GitHub/Nino/src/Nino.UnitTests/Nino.UnitTests.csproj : warning NU1701: Package 'Microsoft.CodeAnalysis.Workspaces.Common 1.0.1' was restored using '.NETFramework,Version=v4.6.1, .NETFramework,Version=v4.6.2, .NETFramework,Version=v4.7, .NETFramework,Version=v4.7.1, .NETFramework,Version=v4.7.2, .NETFramework,Version=v4.8, .NETFramework,Version=v4.8.1' instead of the project target framework 'net6.0'. This package may not be fully compatible with your project.
    /Users/jason/Documents/GitHub/Nino/src/Nino.UnitTests/Nino.UnitTests.csproj : warning NU1701: Package 'Microsoft.Composition 1.0.27' was restored using '.NETFramework,Version=v4.6.1, .NETFramework,Version=v4.6.2, .NETFramework,Version=v4.7, .NETFramework,Version=v4.7.1, .NETFramework,Version=v4.7.2, .NETFramework,Version=v4.8, .NETFramework,Version=v4.8.1' instead of the project target framework 'net6.0'. This package may not be fully compatible with your project.
  Nino.Core net6.0 succeeded (0.7s) → /Users/jason/Documents/GitHub/Nino/src/Nino.Core/bin/Debug/net6.0/Nino.Core.dll
  Nino.Core net8.0 succeeded (0.8s) → /Users/jason/Documents/GitHub/Nino/src/Nino.Core/bin/Debug/net8.0/Nino.Core.dll
  Nino.Generator succeeded (0.3s) → /Users/jason/Documents/GitHub/Nino/src/Nino.Generator/bin/Debug/netstandard2.0/Nino.Generator.dll
  Nino.Core netstandard2.1 succeeded (0.2s) → /Users/jason/Documents/GitHub/Nino/src/Nino.Core/bin/Debug/netstandard2.1/Nino.Core.dll
  Nino.UnitTests.Subset succeeded (0.2s) → /Users/jason/Documents/GitHub/Nino/src/Nino.UnitTests.Subset/bin/Debug/netstandard2.1/Nino.UnitTests.Subset.dll
  Nino.UnitTests net6.0 succeeded with 79 warning(s) (2.2s) → bin/Debug/net6.0/Nino.UnitTests.dll

Build succeeded with 161 warning(s) in 4.7s

❯ ls msbuild*
msbuild.binlogExtract Compiler Parameters
提取编译器参数
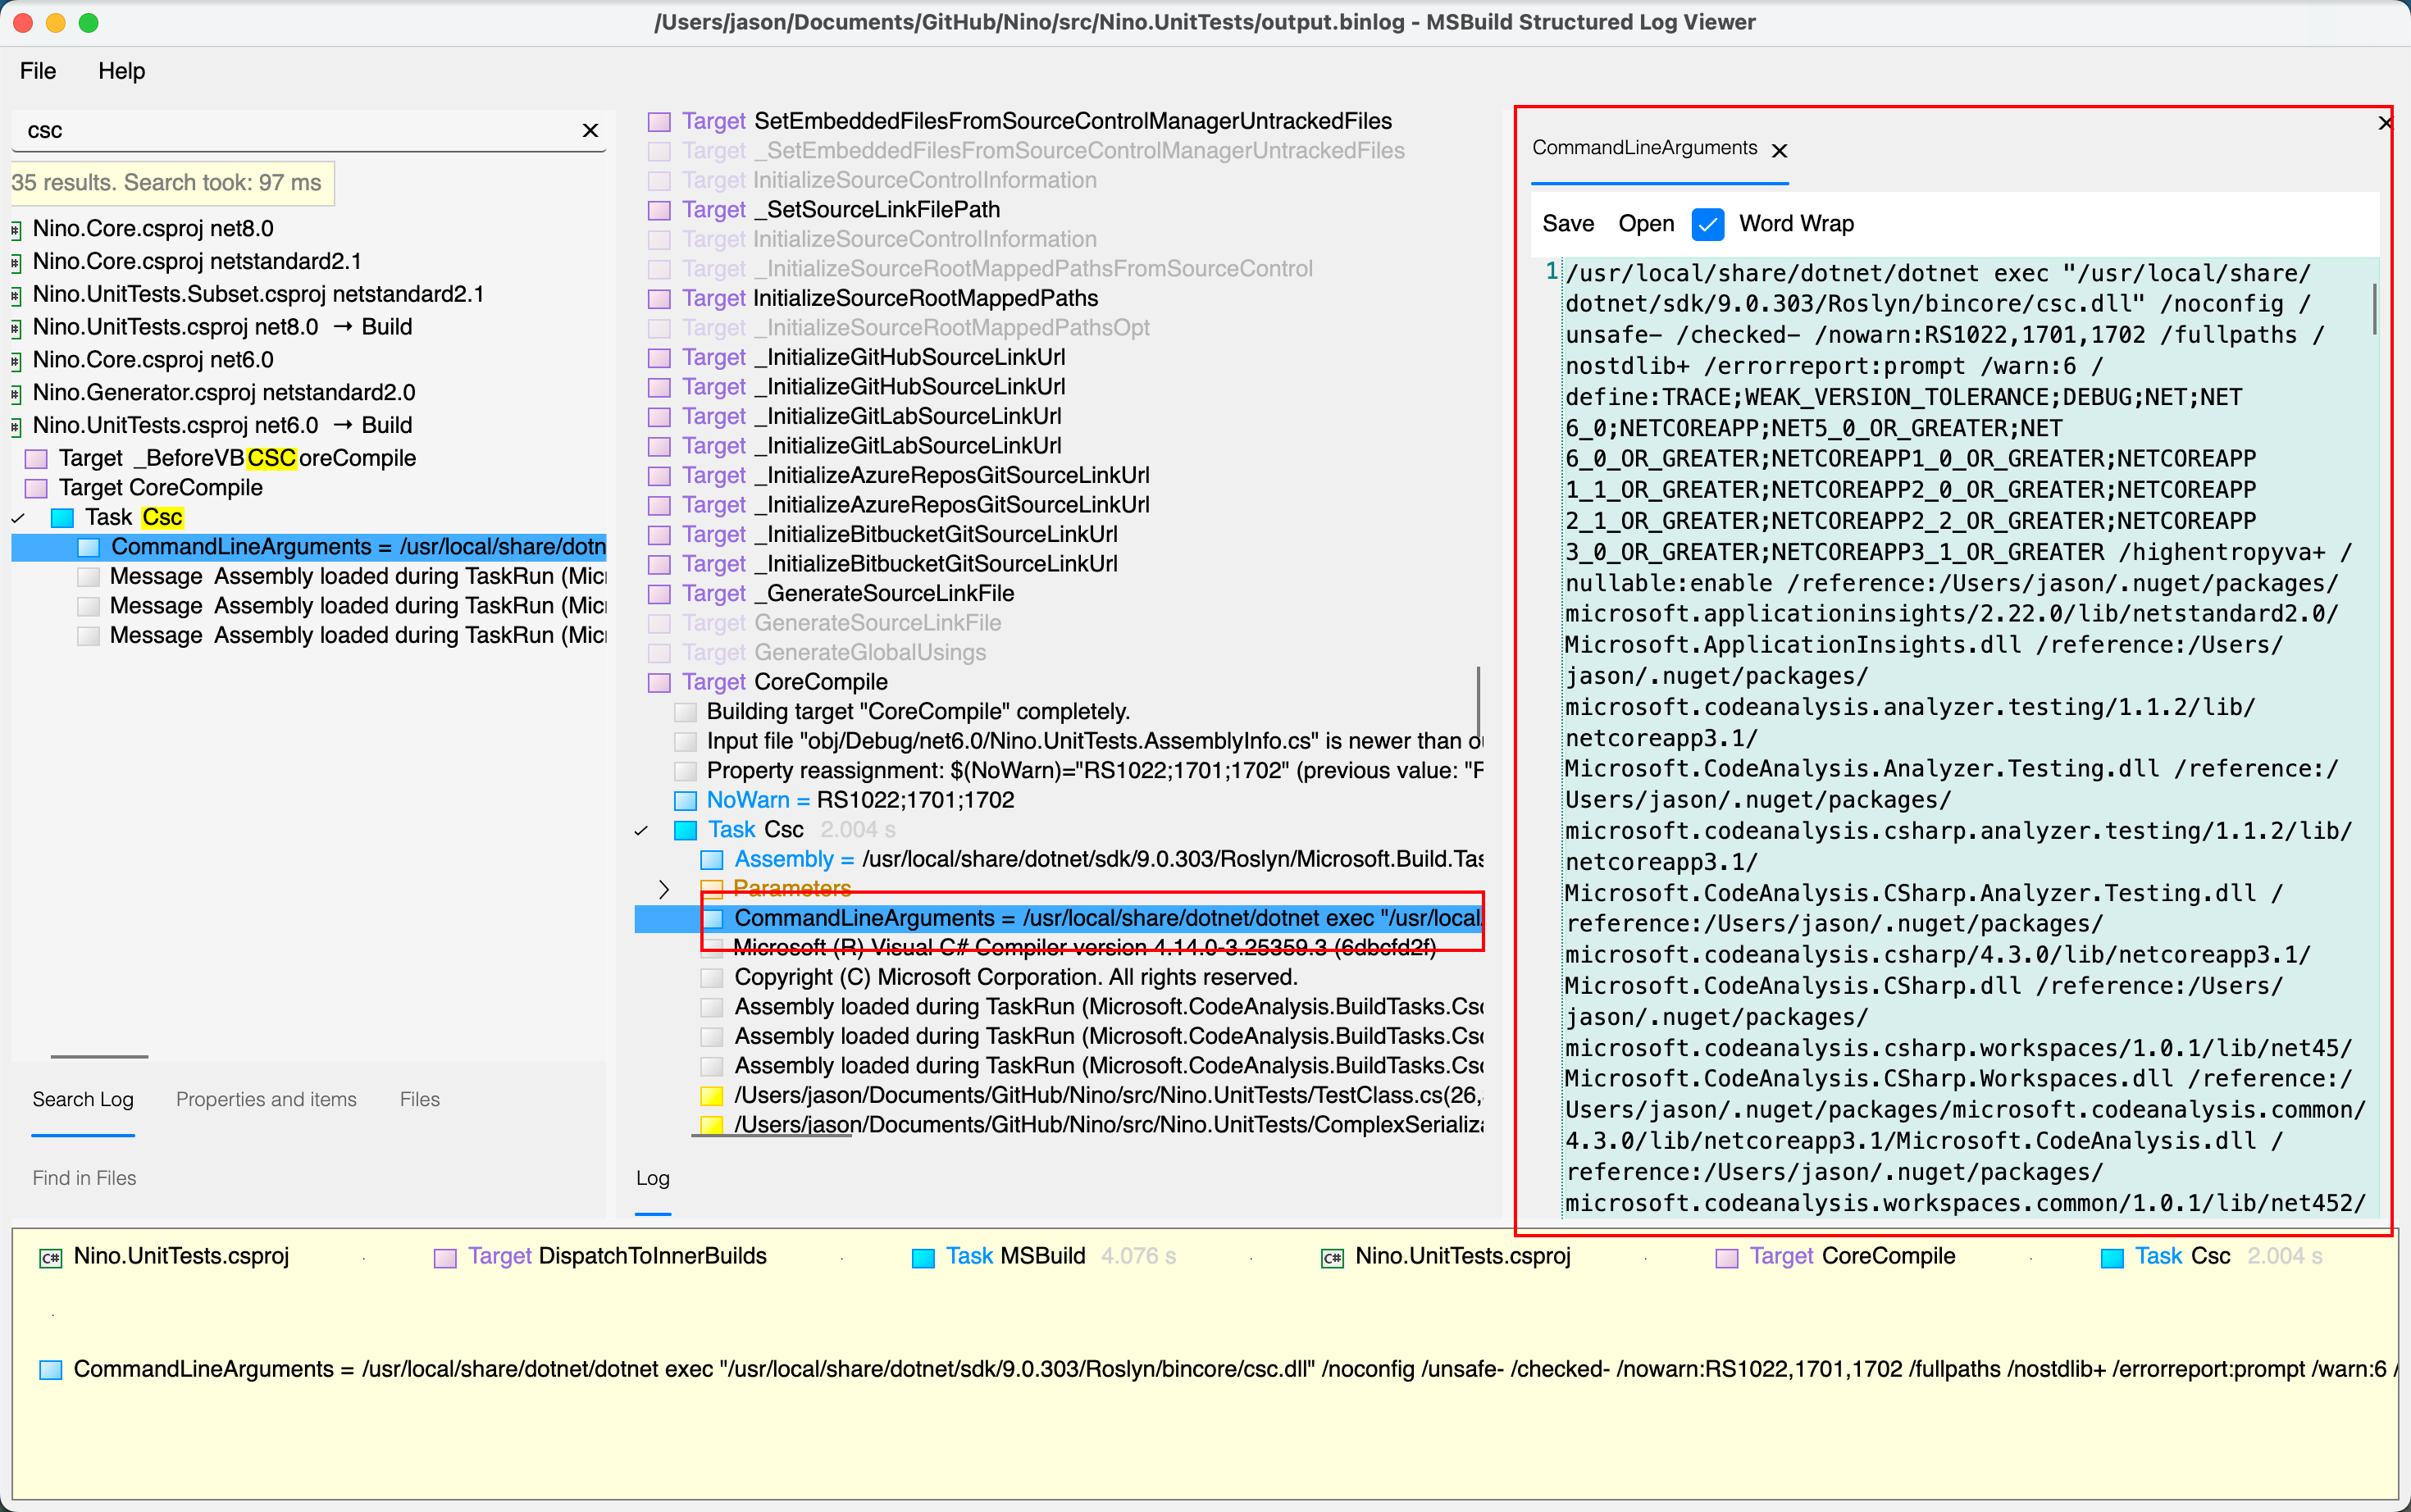
Next, open the generated msbuild.binlog file using MSBuildStructuredLog. This tool provides a visual interface to browse through the build process.
Steps to extract compiler parameters:
- Open
msbuild.binlogin MSBuildStructuredLog (File → Open Log File) - In the left search box, search for
csc - From the search results, select the Csc task for your target project (make sure you select the correct project you want to profile)
- In the right panel, double-click on CommandLineArguments to open and view the full content
- Copy all the command line arguments
WARNING
Make sure to select the Csc task for the correct project. If your solution has multiple projects, there will be multiple Csc tasks - choose the one that corresponds to the project using the Source Generator you want to profile.
These arguments contain all the parameters needed for compilation, including:
- Source files to compile
- Referenced assemblies
- Source Generator configurations
- Compiler options
接下来,使用 MSBuildStructuredLog 打开生成的 msbuild.binlog 文件。这个工具提供了可视化界面来浏览构建过程。
提取编译器参数的步骤:
- 在 MSBuildStructuredLog 中打开
msbuild.binlog(File → Open Log File) - 在左侧搜索框中搜索
csc - 从搜索结果中,选中你要分析性能的项目对应的 Csc 任务(确保选中正确的项目)
- 在右侧面板中,双击 CommandLineArguments 打开查看完整内容
- 复制所有命令行参数
WARNING
确保选择正确项目的 Csc 任务。如果你的解决方案有多个项目,会有多个 Csc 任务 - 选择与你想要分析性能的 Source Generator 对应的项目。
这些参数包含了编译所需的全部信息,包括:
- 要编译的源文件
- 引用的程序集
- Source Generator 配置
- 编译器选项

Create Response File
创建响应文件
The CommandLineArguments you copied will be very long. It contains three key parts that we’ll use later:
- dotnet executable path - e.g.,
/usr/local/share/dotnet/dotnet - csc.dll path - e.g.,
/usr/local/share/dotnet/sdk/9.0.303/Roslyn/bincore/csc.dll - Compiler arguments - everything after
csc.dll, starting from/noconfigto the end
The complete structure looks like this:
/usr/local/share/dotnet/dotnet exec "/usr/local/share/dotnet/sdk/9.0.303/Roslyn/bincore/csc.dll" /noconfig /unsafe- /checked- /nowarn:...Now, save the compiler arguments part (starting from /noconfig) to a response file (.rsp file). A response file is a text file that contains command line arguments, which can be passed to the compiler using the @ symbol.
Create a file named compile.rsp (or any name you prefer) in the project directory that uses the Source Generator (where the .csproj file is located), and paste only the compiler arguments (from /noconfig onwards) into it.
WARNING
Make sure to save the file with UTF-8 encoding to avoid encoding issues.
你复制的 CommandLineArguments 会非常长。它包含三个关键部分,我们后续会用到:
- dotnet 可执行文件路径 - 例如:
/usr/local/share/dotnet/dotnet - csc.dll 路径 - 例如:
/usr/local/share/dotnet/sdk/9.0.303/Roslyn/bincore/csc.dll - 编译器参数 -
csc.dll之后的所有内容,从/noconfig开始到最后
完整的结构如下:
/usr/local/share/dotnet/dotnet exec "/usr/local/share/dotnet/sdk/9.0.303/Roslyn/bincore/csc.dll" /noconfig /unsafe- /checked- /nowarn:...现在,将编译器参数部分(从 /noconfig 开始)保存到一个响应文件(.rsp 文件)中。响应文件是一个文本文件,包含命令行参数,可以通过 @ 符号传递给编译器。
在使用了 Source Generator 的项目目录(包含 .csproj 文件的目录)中创建一个名为 compile.rsp 的文件(或任何你喜欢的名字),然后只粘贴编译器参数(从 /noconfig 开始)到文件中。
WARNING
确保文件使用 UTF-8 编码保存,以避免编码问题。
/noconfig
/nowarn:1701,1702
/fullpaths
/define:DEBUG;TRACE
/reference:path/to/reference1.dll
/reference:path/to/reference2.dll
... (all other compiler arguments)Profile with dotTrace
使用dotTrace进行性能分析
Now comes the crucial step: using JetBrains dotTrace to profile the compilation process. By profiling the compilation of the project that uses the Source Generator, we can analyze the internal function execution times within the Source Generator itself. This allows us to see exactly which functions in the Source Generator are consuming the most time.
现在进入关键步骤:使用 JetBrains dotTrace 对编译过程进行性能分析。通过对使用 Source Generator 的项目的编译过程进行性能分析,我们可以分析 Source Generator 本身内部的函数执行时间。这让我们能准确看到 Source Generator 中哪些函数消耗了最多时间。
Launch dotTrace Configuration
启动 dotTrace 配置
Open JetBrains dotTrace
Create a new profiling session (you can name it anything you like, e.g., "Profile Source Generator")
Select Standalone mode
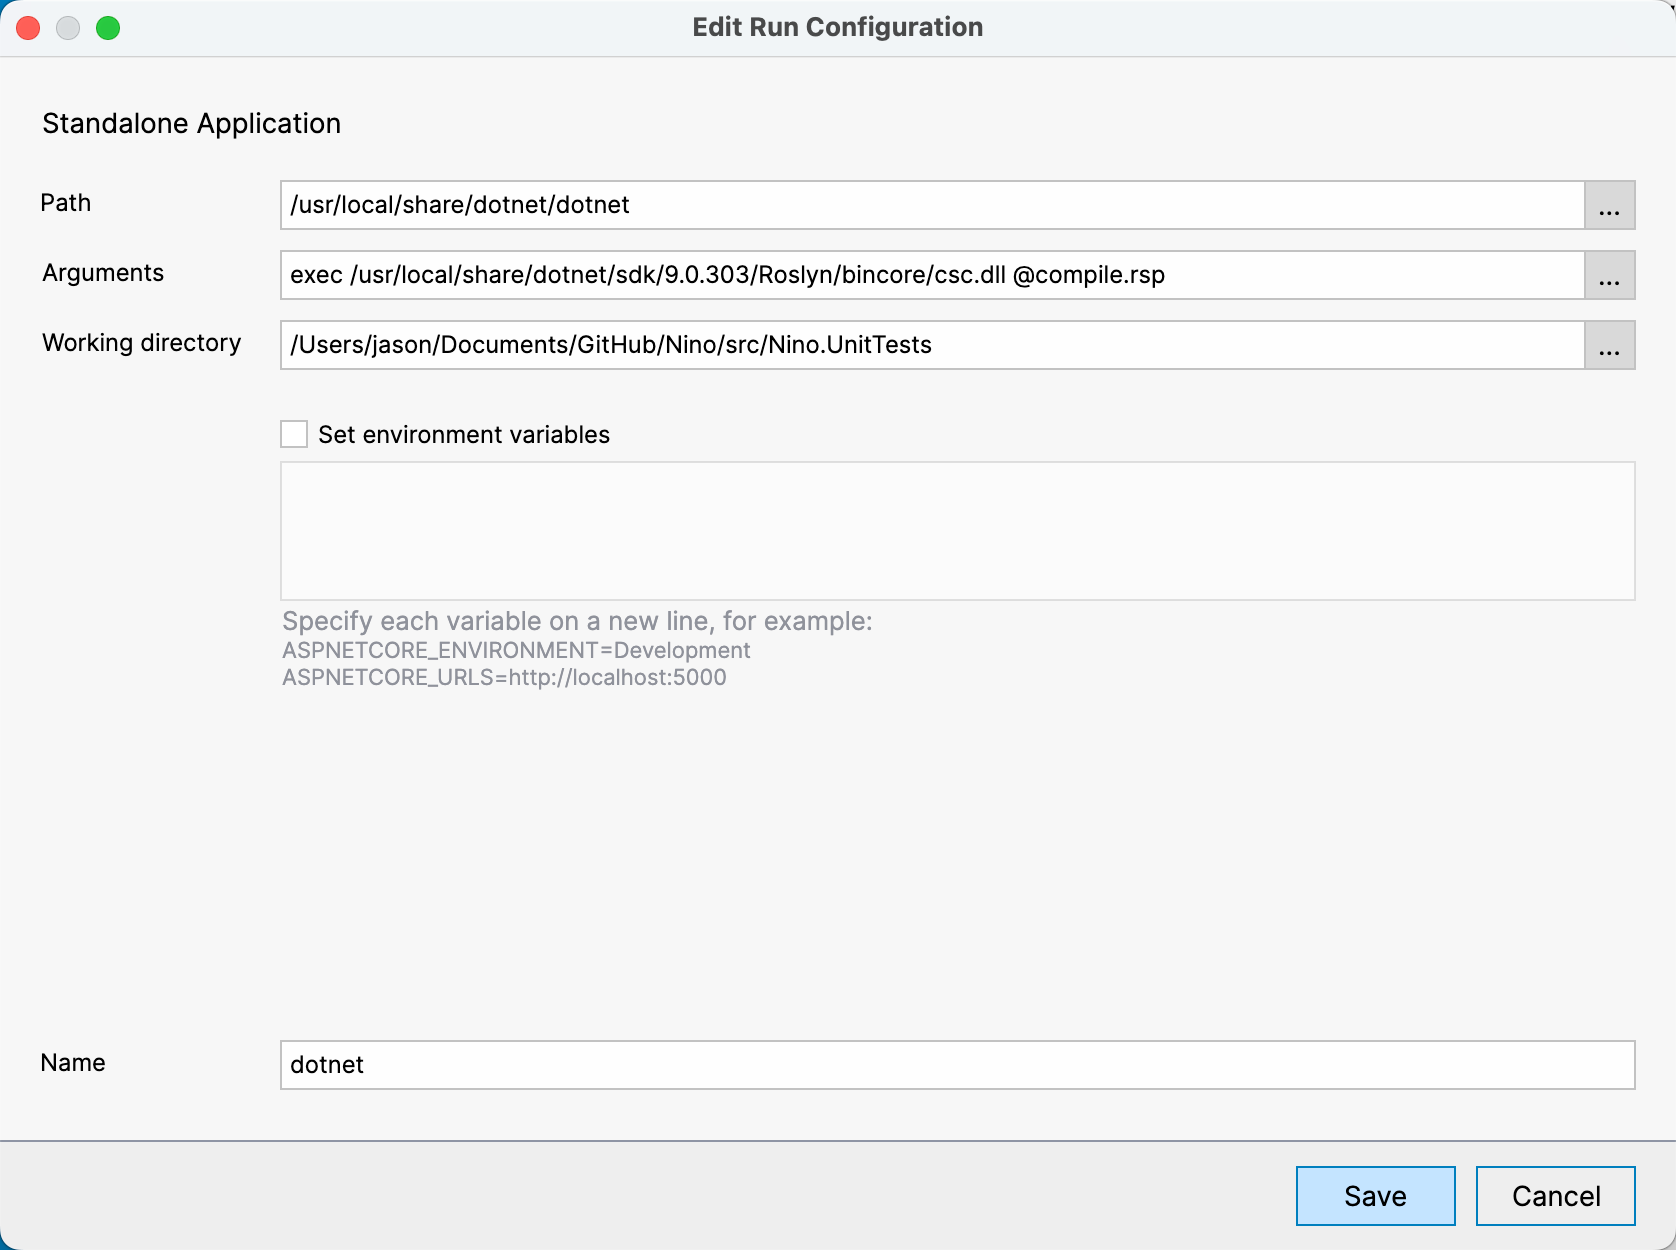
Configure the profiling target:
Application: The dotnet executable path from Step 3
- Use the path you found in the CommandLineArguments (before
exec) - Example:
/usr/local/share/dotnet/dotnetorC:\Program Files\dotnet\dotnet.exe
- Use the path you found in the CommandLineArguments (before
Arguments:
exec <csc.dll path from Step 3> @compile.rspUse the csc.dll path you found in Step 3. For example:
exec /usr/local/share/dotnet/sdk/9.0.303/Roslyn/bincore/csc.dll @compile.rspWARNING
The
@symbol is crucial - it tells the compiler to read arguments from the response file.Working directory: The project directory that uses the Source Generator (where the
.csprojandcompile.rspfiles are located)
Profiling Settings:
- Profiling type: Select Timeline
- Enable "Profile child processes" (or "Entire process tree") - This is critical! The C# compiler runs in multiple processes, and Source Generators execute in child processes. Without this option enabled, you won’t see any Source Generator timing data.
- Enable "Collect TPL events" - This is important for capturing detailed timing information during compilation
Click Run to start profiling
打开 JetBrains dotTrace
创建新的性能分析会话(名称可以随便写,例如 "分析 Source Generator")
选择 Standalone 模式
配置分析目标:
Application(应用程序):步骤三中的 dotnet 可执行文件路径
- 使用你在 CommandLineArguments 中找到的路径(
exec之前的部分) - 例如:
/usr/local/share/dotnet/dotnet或C:\Program Files\dotnet\dotnet.exe
- 使用你在 CommandLineArguments 中找到的路径(
Arguments(参数):
exec <步骤三中的 csc.dll 路径> @compile.rsp使用你在步骤三中找到的 csc.dll 路径。例如:
exec /usr/local/share/dotnet/sdk/9.0.303/Roslyn/bincore/csc.dll @compile.rspWARNING
@符号必须有 - 它告诉编译器从响应文件中读取参数。Working directory(工作目录):使用了 Source Generator 的项目目录(包含
.csproj和compile.rsp文件的目录)
性能分析设置:
- 分析类型:选择 Timeline(时间线)
- 启用 "Profile child processes"(分析子进程)或 "Entire process tree"(整个进程树) - 这非常关键! C# 编译器是多进程运行的,Source Generator 在子进程中执行。如果不启用这个选项,你将看不到任何 Source Generator 的耗时数据。
- 启用 "Collect TPL events"(收集 TPL 事件) - 这对于捕获编译时的详细耗时数据非常重要
点击 Run(运行)开始分析
Understanding dotTrace Settings
理解 dotTrace 设置
Let’s explain why these settings are important:
- Timeline profiling: Provides a time-based view of method execution, perfect for analyzing compilation performance
- Entire process tree (Profile child processes): Critical for profiling Source Generators! The C# compiler spawns multiple child processes to execute Source Generators. If this option is disabled, the profiler will only capture the main compiler process, and you won’t see any data from the Source Generator execution. This is the most important setting for our use case.
- Collect TPL events: Captures Task Parallel Library events, which is essential since Source Generators often use async/await and parallel operations
让我们解释一下为什么这些设置很重要:
- Timeline 分析:提供基于时间的方法执行视图,非常适合分析编译性能
- 整个进程树(分析子进程):分析 Source Generator 的关键设置! C# 编译器会创建多个子进程来执行 Source Generator。如果禁用这个选项,性能分析器只会捕获主编译器进程,你将看不到 Source Generator 执行的任何数据。这是我们使用场景中最重要的设置。
- 收集 TPL 事件:捕获任务并行库事件,这很重要,因为 Source Generator 经常使用 async/await 和并行操作
Analyze Profiling Results
分析性能结果
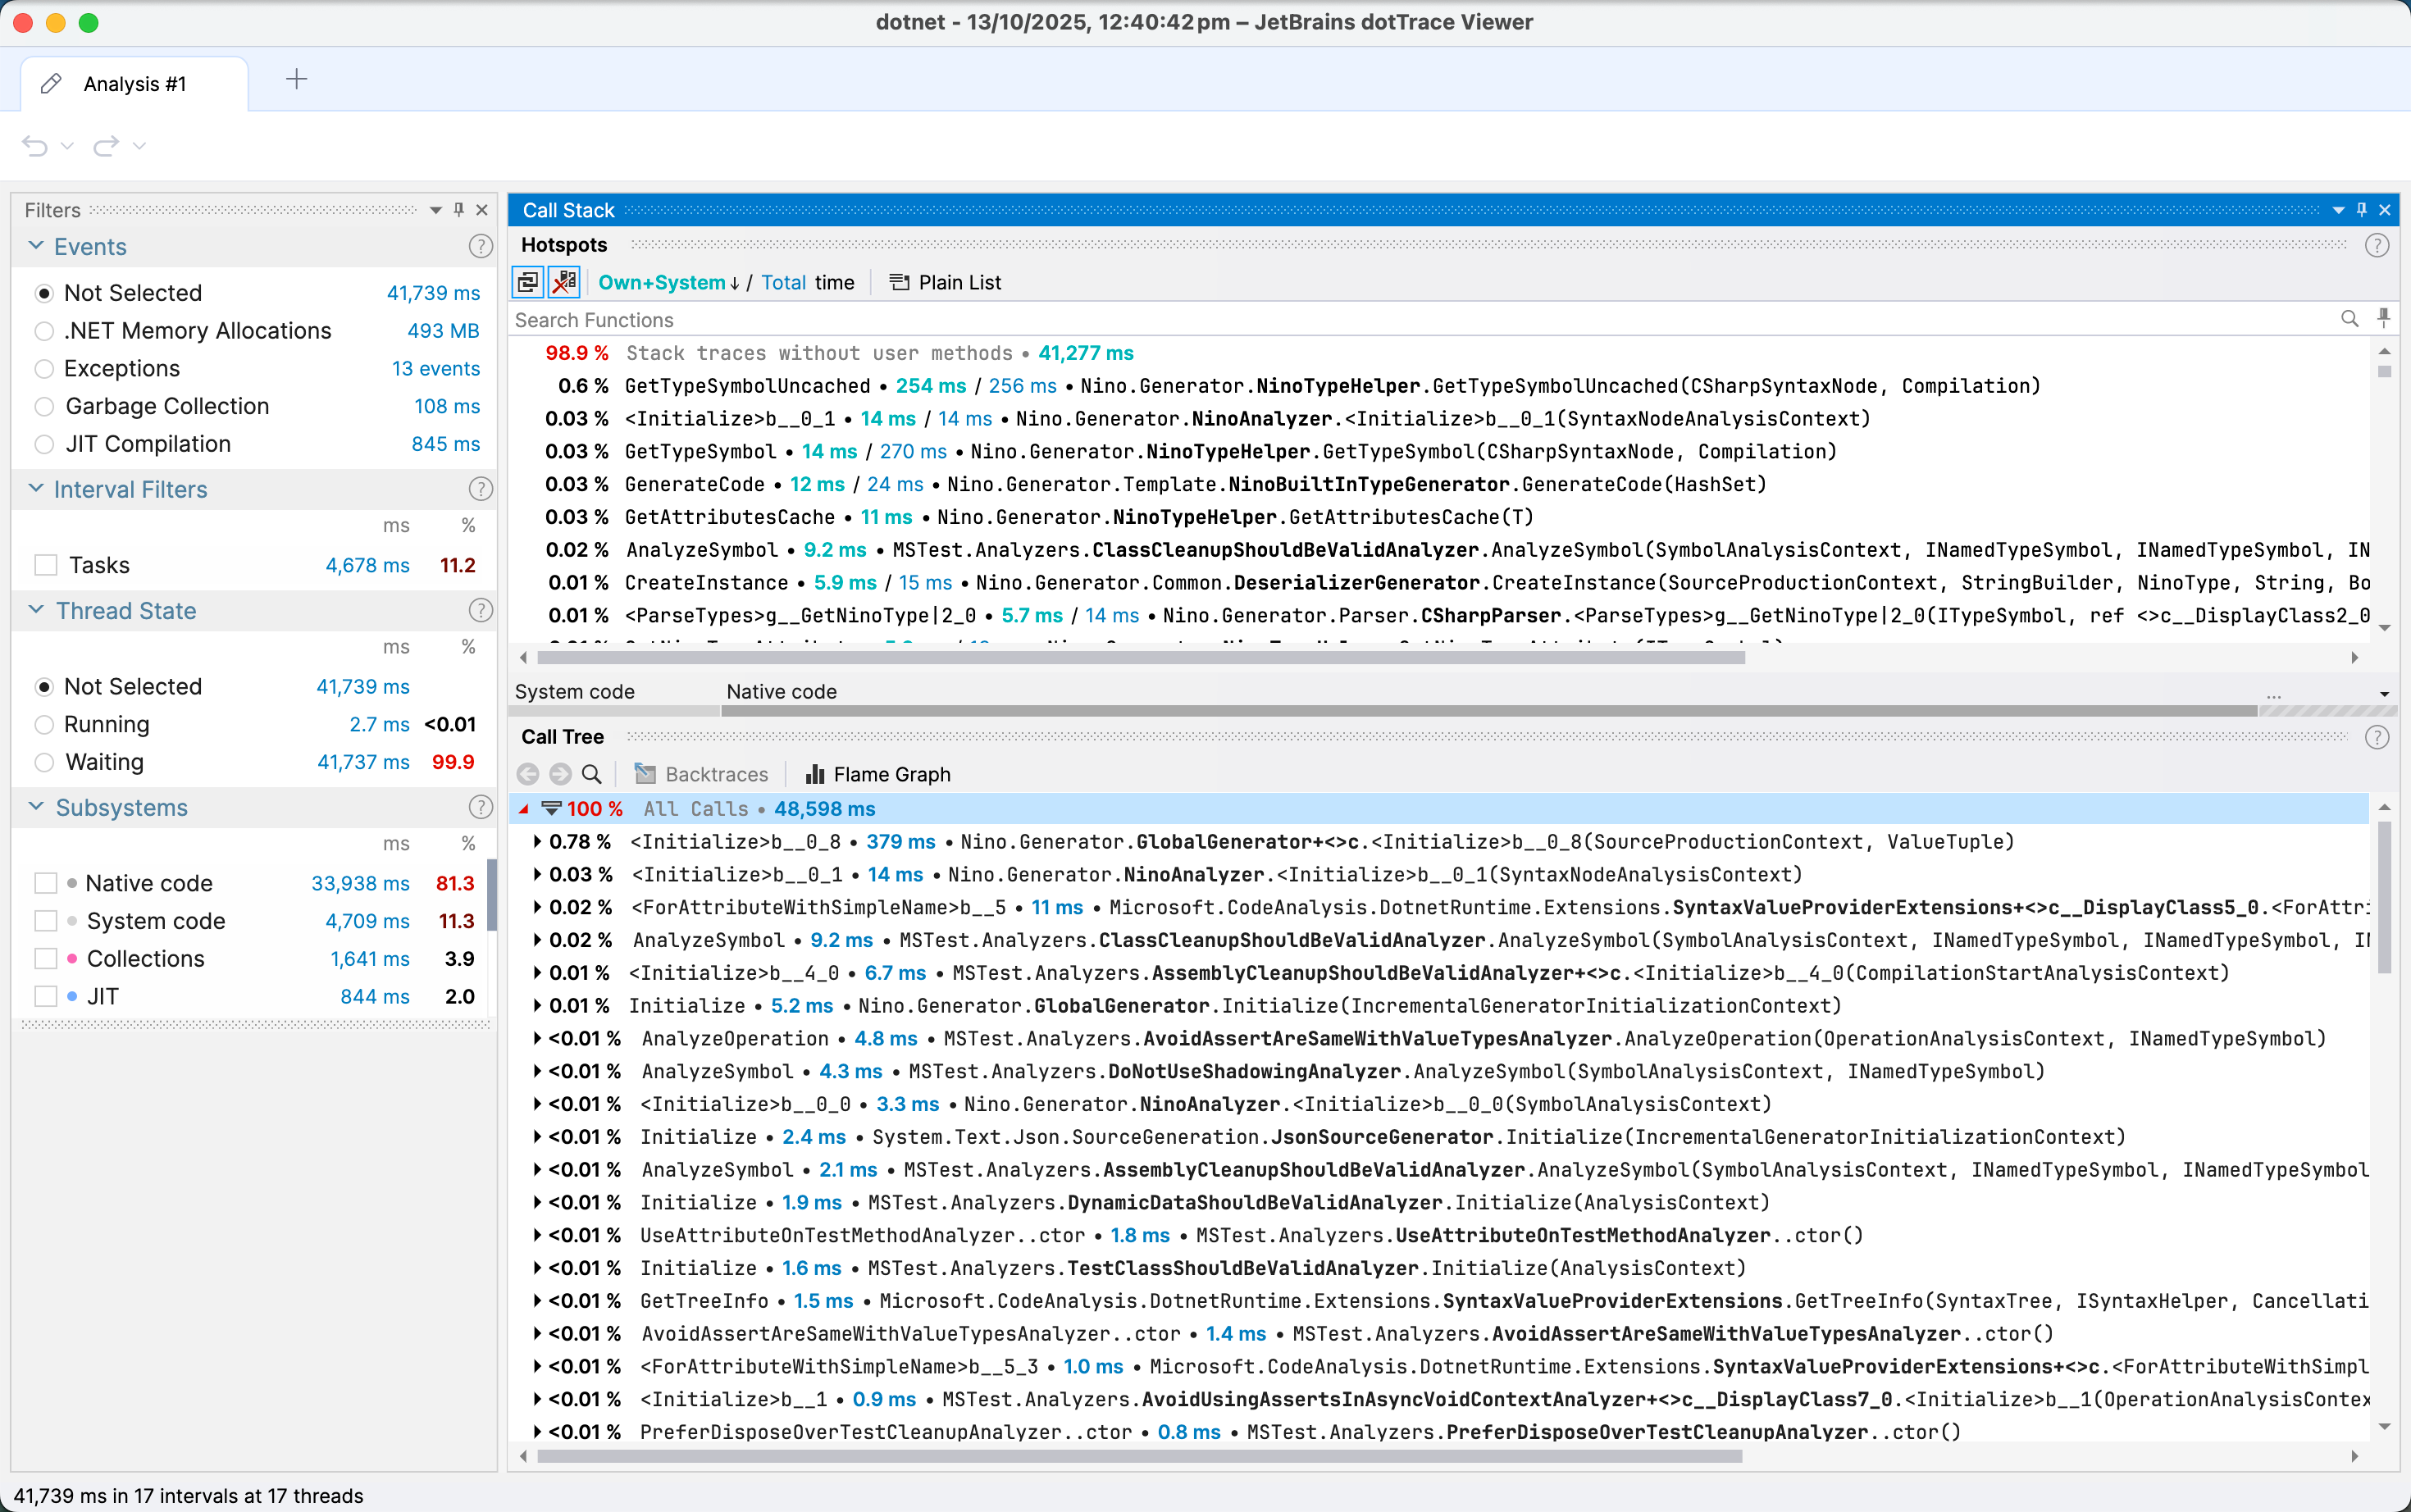
After the profiling session completes, dotTrace will present you with a detailed timeline view of the compilation process. You can now analyze which parts of your Source Generator are consuming the most time.
性能分析会话完成后,dotTrace 会呈现编译过程的详细时间线视图。现在你可以分析 Source Generator 的哪些部分消耗了最多时间。
Key Areas to Examine
关键检查区域
- Call Tree: Shows the hierarchical structure of method calls and their execution times
- Pro Tip: You can double-click any function in the Call Tree to view its decompiled source code. This allows you to see exactly what the function is doing and identify optimization opportunities.
- Hot Spots: Identifies methods that consume the most time
- Timeline: Visual representation of when methods were executed
Look for:
- Methods with high Total Time (including time spent in called methods)
- Methods with high Own Time (time spent in the method itself)
- Repeated method calls that could be optimized
- Expensive I/O operations or string allocations
- 调用树(Call Tree):显示方法调用的层次结构及其执行时间
- 实用技巧:你可以在调用树中双击任何函数来查看其反编译的源代码。这让你能准确看到函数在做什么,从而识别优化机会。
- 热点(Hot Spots):识别消耗最多时间的方法
- 时间线(Timeline):方法执行时间的可视化表示
需要关注:
- 具有高 Total Time(总时间,包括调用其他方法的时间)的方法
- 具有高 Own Time(自身时间,方法本身花费的时间)的方法
- 可以优化的重复方法调用
- 昂贵的 I/O 操作或字符串分配
Common Performance Bottlenecks
常见性能瓶颈
Based on the profiling results, you might discover:
- Excessive string allocations: StringBuilder or span-based approaches can help
- Repeated compilation parsing: Cache parsed syntax trees when possible
- Inefficient LINQ queries: Consider using for loops for better performance
- Unnecessary file I/O: Batch operations or use in-memory alternatives
- Redundant symbol lookups: Cache semantic model queries
根据性能分析结果,你可能会发现:
- 过多的字符串分配:使用 StringBuilder 或基于 span 的方法可以改善
- 重复的编译解析:尽可能缓存解析的语法树
- 低效的 LINQ 查询:考虑使用 for 循环以获得更好的性能
- 不必要的文件 I/O:批量操作或使用内存中的替代方案
- 冗余的符号查找:缓存语义模型查询

Troubleshooting
故障排除
Common Issues
常见问题
Response file path issues
- Make sure the working directory is set correctly
- Alternatively, use an absolute path in the argument:
@C:\path\to\compile.rsp
csc.dll not found
- Verify your .NET SDK installation path
- Check the SDK version matches your project
Compilation fails during profiling
- Ensure all referenced assemblies in the
.rspfile use absolute paths - Verify the
.rspfile encoding is UTF-8
- Ensure all referenced assemblies in the
No Source Generator data in profile
- Make sure "Entire process tree" is enabled
- Verify "Collect TPL events" is checked
- Ensure your Source Generator is actually being invoked during compilation
响应文件路径问题
- 确保工作目录设置正确
- 或者在参数中使用绝对路径:
@C:\path\to\compile.rsp
找不到 csc.dll
- 验证 .NET SDK 安装路径
- 检查 SDK 版本是否与项目匹配
性能分析期间编译失败
- 确保
.rsp文件中的所有引用程序集使用绝对路径 - 验证
.rsp文件编码是 UTF-8
- 确保
性能分析结果中没有 Source Generator 数据
- 确保启用了"整个进程树"
- 验证已勾选"收集 TPL 事件"
- 确保编译期间确实调用了 Source Generator
Optimization Tips
优化建议
Once you’ve identified performance bottlenecks, here are some optimization strategies:
一旦识别出性能瓶颈,以下是一些优化策略:
Use Incremental Source Generators
使用增量式 Source Generator
Incremental Source Generators (introduced in Roslyn 4.0+) provide better performance by only regenerating code when necessary.
增量式 Source Generator(在 Roslyn 4.0+ 中引入)通过仅在必要时重新生成代码来提供更好的性能。
Cache Expensive Operations
缓存昂贵的操作
Cache results of expensive operations like:
- Symbol lookups
- Type checking
- Syntax tree parsing
缓存以下昂贵操作的结果:
- 符号查找
- 类型检查
- 语法树解析
Minimize String Allocations
最小化字符串分配
Use:
Span<char>andReadOnlySpan<char>where possibleStringBuilderfor complex string building- String interpolation with
DefaultInterpolatedStringHandler
使用:
- 尽可能使用
Span<char>和ReadOnlySpan<char> - 使用
StringBuilder构建复杂字符串 - 使用
DefaultInterpolatedStringHandler进行字符串插值
Avoid Unnecessary Diagnostics
避免不必要的诊断
Only report diagnostics when absolutely necessary, as they have overhead.
仅在绝对必要时报告诊断,因为它们有开销。
Use Source Generator Testing Tools
使用 Source Generator 测试工具
Test your generator with various input sizes to identify scaling issues.
使用各种输入大小测试生成器,以识别扩展性问题。
Conclusion
结论
In this article, we’ve covered how to profile Source Generator performance using MSBuildStructuredLog and dotTrace. By following these steps, you can:
- Extract exact compiler parameters from build logs
- Reproduce the compilation process in a profiling environment
- Identify performance bottlenecks in your Source Generator
- Apply targeted optimizations to improve build times
This approach is particularly useful when dealing with complex Source Generators that significantly impact build performance. The insights gained from profiling can guide you to make informed optimization decisions, ultimately leading to faster builds and a better developer experience.
在本文中,我们介绍了如何使用 MSBuildStructuredLog 和 dotTrace 分析 Source Generator 的性能。通过遵循这些步骤,你可以:
- 从构建日志中提取准确的编译器参数
- 在性能分析环境中重现编译过程
- 识别 Source Generator 中的性能瓶颈
- 应用针对性的优化来改善构建时间
这种方法在处理显著影响构建性能的复杂 Source Generator 时特别有用。从性能分析中获得的洞察可以指导你做出明智的优化决策,最终实现更快的构建速度和更好的开发体验。